


The Big Bull
Latest and next big crypto pump signals. We identify coins on the verge of massive growth. We also provide expert analysis so you never miss the next big move!
Contact - @Danny820
#DYOR Связанные каналы | Похожие каналы
21 589
подписчиков
Популярное в канале
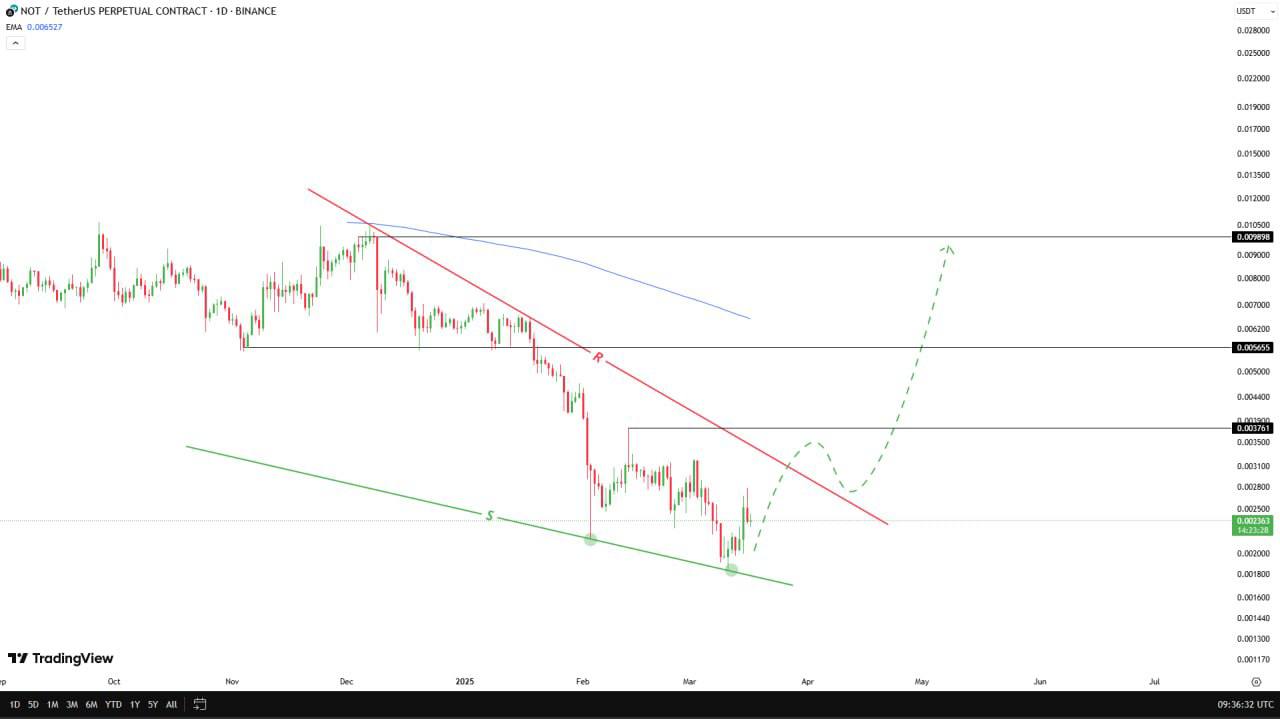
#NOTUSDT The cryptocurrency is testing the upper boundary of the downtrend on the daily timeframe...
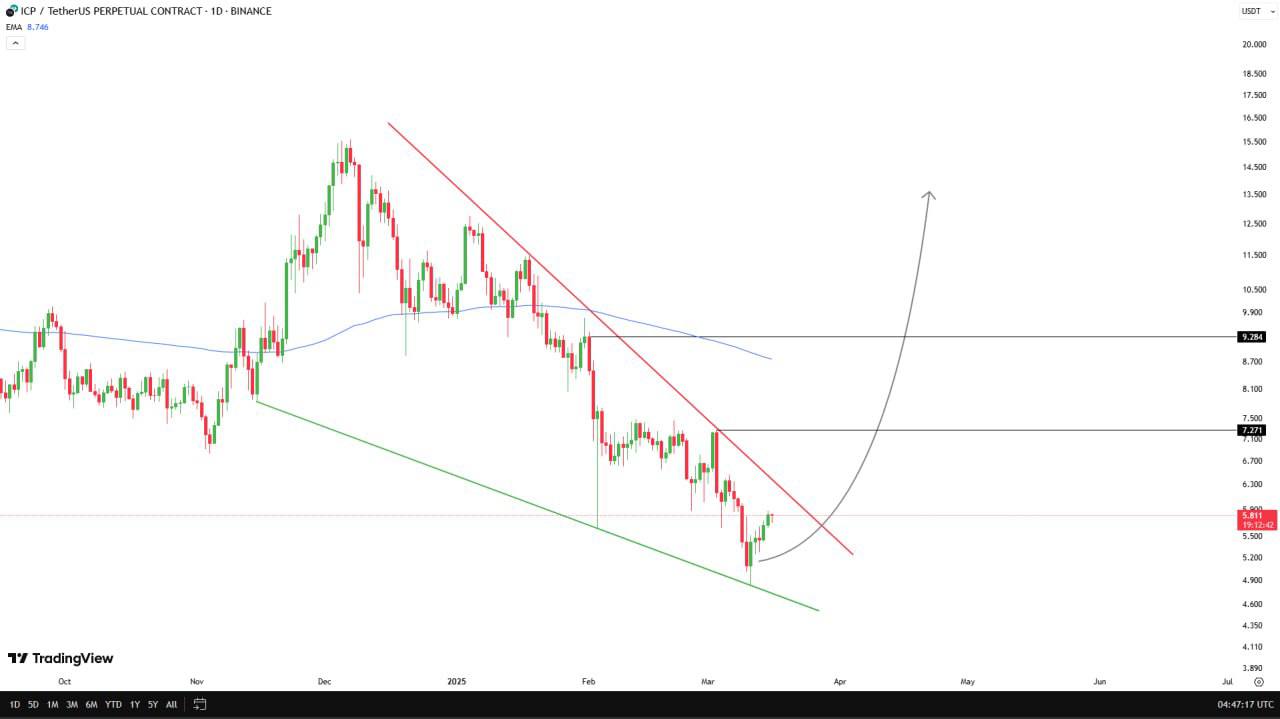
#ICPUSDT Internet Computer has reached support at the lower boundary of the bearish pattern on th...
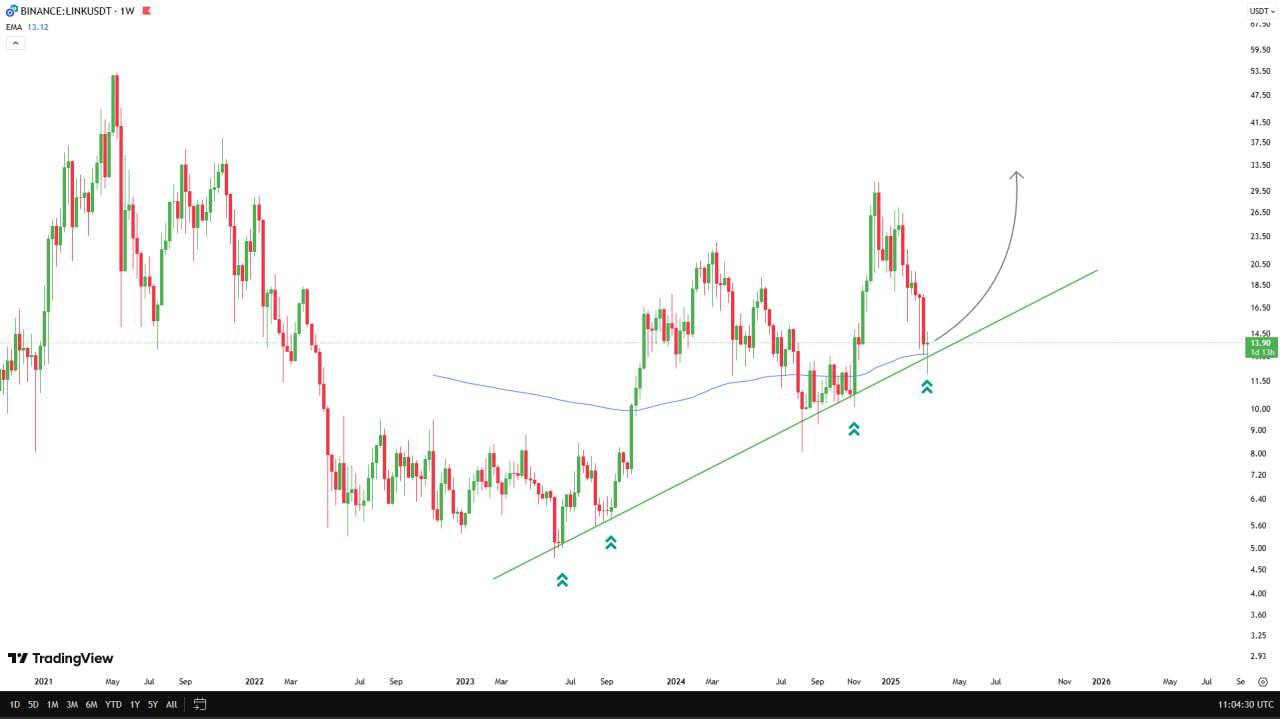
#LINKUSDT The link has bounced off the strong support of the 200-day EMA and the ascending trend ...
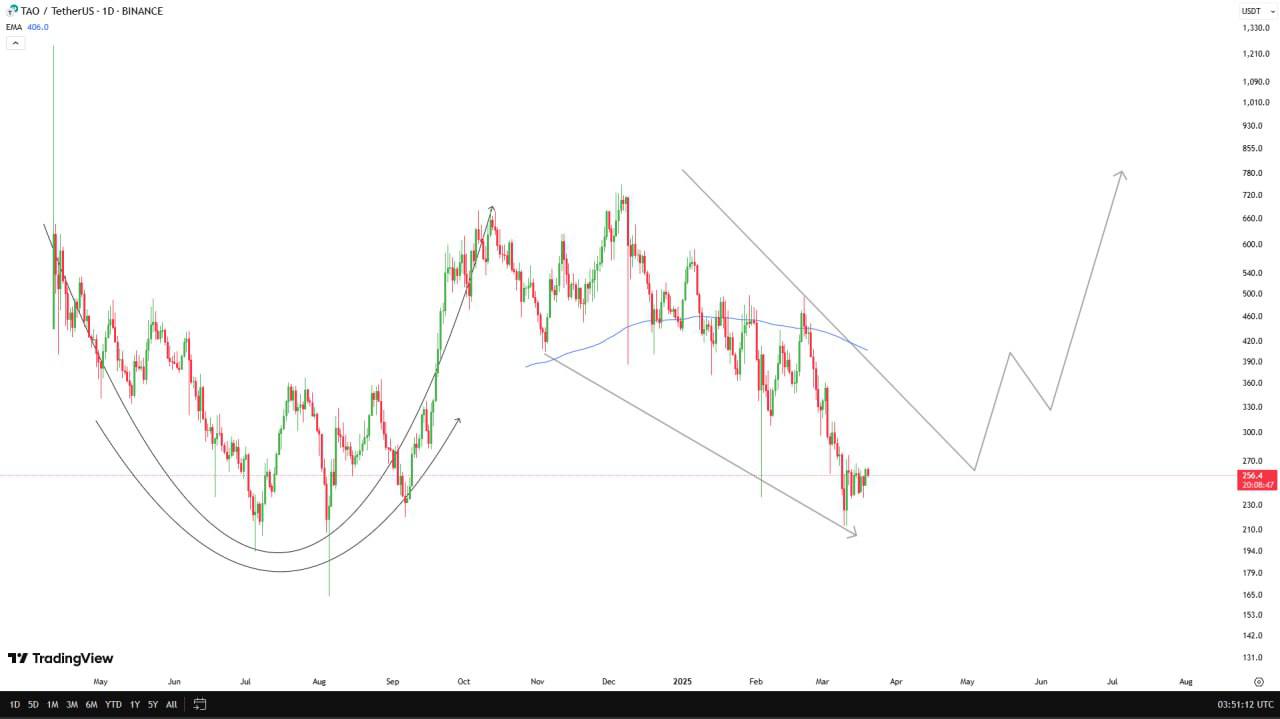
#TAOUSDT Bittensor, one of the top projects in the AI & DePIN sectors, is currently accumulating ...
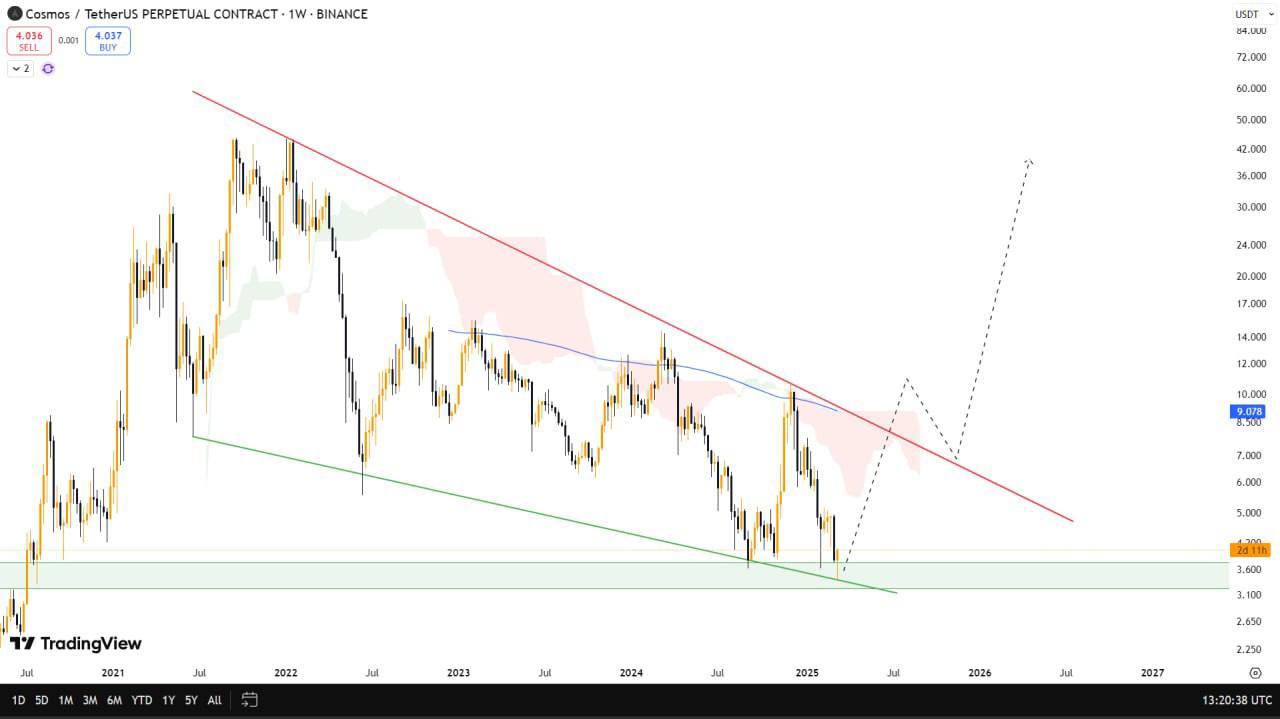
#ATOM/USDT The atom is consolidating near the lower boundary of the descending angle pattern on t...