
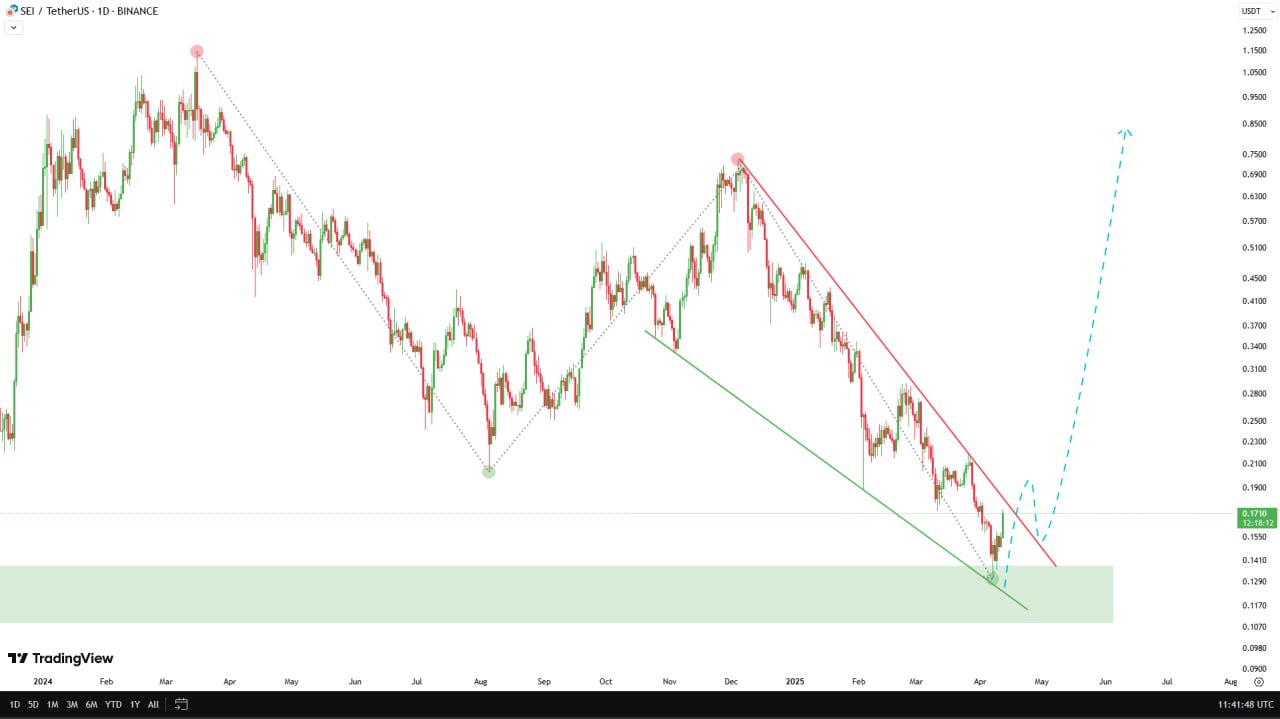
#SEIUSDT SEI's first bullish wave produced more than 1,101% growth. The peak happened in March 2024. After this peak, bearish all the way. The next major low happened on the 7-April 2025 trading session, 3D. More than a year of bearish action. I say this is enough.
A long-term higher low is present vs October 2023. The chart is clear and easy. Market conditions are about to change. The high volume on the more than a year strong higher low indicates that buyers were present. Support is activated but still early. Confirmation comes when multiple sessions close green without the last low, 0.1303, getting challenged again.
A long-term higher low is present vs October 2023. The chart is clear and easy. Market conditions are about to change. The high volume on the more than a year strong higher low indicates that buyers were present. Support is activated but still early. Confirmation comes when multiple sessions close green without the last low, 0.1303, getting challenged again.