


The Big Bull
Latest and next big crypto pump signals. We identify coins on the verge of massive growth. We also provide expert analysis so you never miss the next big move!
Contact - @Danny820
#DYOR Related channels | Similar channels
21 352
subscribers
Popular in the channel
If you want to join our VIP Channel at 50% Discount then Contact - @Danny820 3 Months Subscripti...
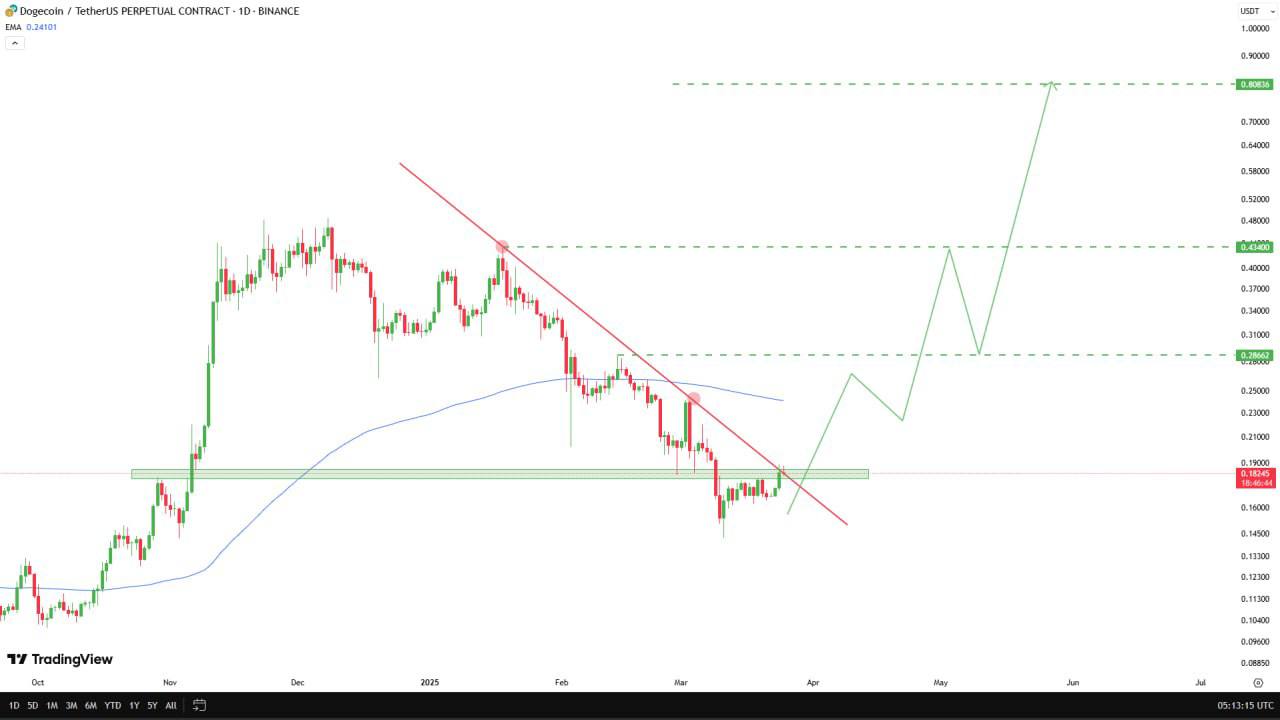
#DOGEUSDT Dogecoin is testing a key multiple resistance area. I think it could easily double if ...
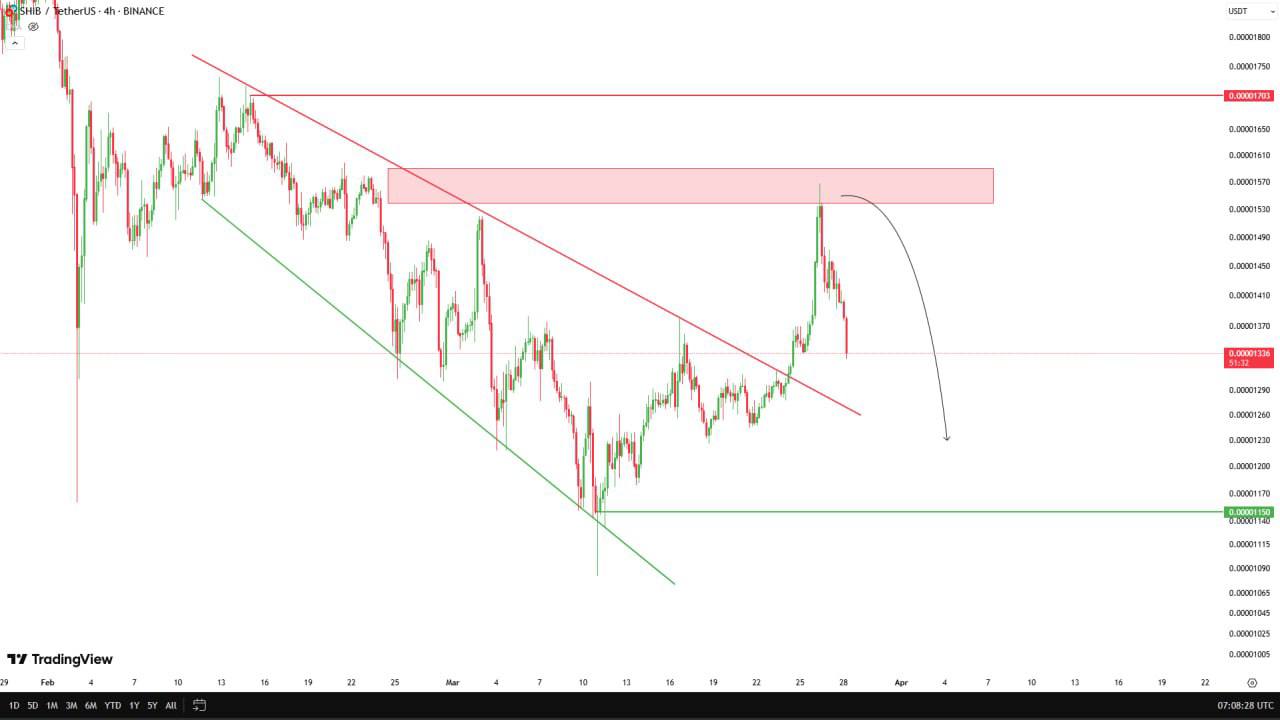
#SHIBUSDT has recently broken out of a Descending Broadening Wedge Formation on the 4H chart, a p...

#BLURUSDT The price is in an upward trend after breaking the downward trendline and we should wai...

Polkadot (DOT) Daily Timeframe Analysis Current Price: $3.98 Support Zone: $3.55 and $4.50 Resi...